Financial Highlights
| GROUP | BANK | |||||
| 2015 | 2014 | Change % |
2015 | 2014 | Change % |
|
| Results for the year (Rs. Bn.) | ||||||
| Gross income | 78.225 | 72.848 | 7.38 | 77.868 | 72.752 | 7.03 |
| Operating profit before financial VAT and tax | 20.013 | 18.542 | 7.93 | 20.033 | 18.425 | 8.73 |
| Profit before taxation (PBT) | 17.136 | 15.860 | 8.05 | 17.144 | 15.736 | 8.94 |
| Income tax expense | 5.277 | 4.617 | 14.29 | 5.240 | 4.556 | 15.02 |
| Profit for the year | 11.859 | 11.243 | 5.48 | 11.903 | 11.180 | 6.47 |
| Revenue to the Governments | 10.772 | 7.295 | 47.66 | 10.682 | 7.235 | 47.64 |
| Gross dividends | 5.700 | 5.630 | 1.24 | 5.700 | 5.630 | 1.24 |
| Position at the year-end (Rs. Bn.) | ||||||
| Shareholders’ funds (Stated capital and reserves) | 70.964 | 71.206 | (0.34) | 70.341 | 70.512 | (0.24) |
| Deposits from customers | 624.021 | 529.267 | 17.90 | 624.102 | 529.361 | 17.90 |
| Gross loans and advances | 528.383 | 423.701 | 24.71 | 526.167 | 422.388 | 24.57 |
| Total assets | 882.183 | 797.258 | 10.65 | 879,805 | 795.610 | 10.58 |
| Information per Ordinary Share (Rs.) | ||||||
| Earnings (Basic) | 13.53 | 12.87 | 5.13 | 13.59 | 12.81 | 6.09 |
| Earnings (Diluted) | 13.51 | 12.82 | 5.38 | 13.57 | 12.75 | 6.43 |
| Dividends – Cash | – | – | – | 4.50 | 4.50 | – |
| Dividends – Shares | – | – | – | 2.00 | 2.00 | – |
| Net assets value | 80.93 | 82.24 | (1.59) | 80.22 | 81.44 | (1.50) |
| Market value at the year-end – Voting | N/A | N/A | – | 140.20 | 171.00 | (18.01) |
| Market value at the year-end – Non-Voting | N/A | N/A | – | 123.00 | 125.10 | (1.68) |
| Ratios | ||||||
| Return on average shareholders’ funds (%) | 16.68 | 18.11 | (1.43) | 16.90 | 17.01 | (0.11) |
| Return on average assets (%) | 1.41 | 1.72 | (0.31) | 1.42 | 1.60 | (0.18) |
| Price earnings (times) – Ordinary Voting Shares | N/A | N/A | 10.33 | 13.24 | (21.98) | |
| Price Earnings (times) – Ordinary Non-Voting Shares | N/A | N/A | 9.06 | 9.69 | (6.50) | |
| Year-on-year growth in earnings (%) | 5.48 | 11.52 | (6.04) | 6.47 | 7.03 | (0.56) |
| Dividend yield (%) – Ordinary Voting Shares | N/A | N/A | 4.64 | 3.80 | 0.84 | |
| Dividend yield (%) – Ordinary Non-Voting Shares | N/A | N/A | 5.28 | 5.20 | 0.08 | |
| Dividend cover on Ordinary Shares (times) | N/A | N/A | 2.09 | 1.99 | 5.03 | |
| Statutory Ratios: | ||||||
| Liquid assets (%) | N/A | N/A | – | 27.72 | 33.11 | (5.39) |
| Capital adequacy ratios: | ||||||
| Tier I (%) – Minimum requirement 5% | 11.55 | 13.07 | (1.52) | 11.60 | 12.93 | (1.33) |
| Tier I & II (%) – Minimum requirement 10% | 14.28 | 16.22 | (1.94) | 14.26 | 15.97 | (1.71) |
Financial Goals and Achievements – Bank
| Goal | Achievement | |||||
| Financial Indicator | 2015 | 2014 | 2013 | 2012 | 2011 | |
| Return on average assets (ROA) (%) | Over 2% | 1.42 | 1.60 | 1.87 | 2.12 | 1.94 |
| Return on average shareholders’ funds (%) | Over 20% | 16.90 | 17.01 | 18.40 | 20.96 | 20.28 |
| Growth in income (%) | Over 20% | 7.03 | 0.96 | 15.40 | 38.25 | 10.45 |
| Growth in profit for the year (%) | Over 20% | 6.47 | 7.03 | 3.44 | 28.10 | 42.72 |
| Growth in total assets (%) | Over 20% | 10.58 | 31.29 | 18.54 | 15.95 | 18.95 |
| Dividend per share (DPS) (Rs.) | Over Rs. 5.00 | 6.50 | 6.50 | 6.50 | 6.50 | 6.00 |
| Capital adequacy ratios: | ||||||
| Tier I (%) – Minimum requirement 5% | Over 8% | 11.60 | 12.93 | 13.27 | 12.64 | 12.11 |
| Tier II (%) – Minimum requirement 10% | Over 13% | 14.26 | 15.97 | 16.91 | 13.85 | 13.01 |
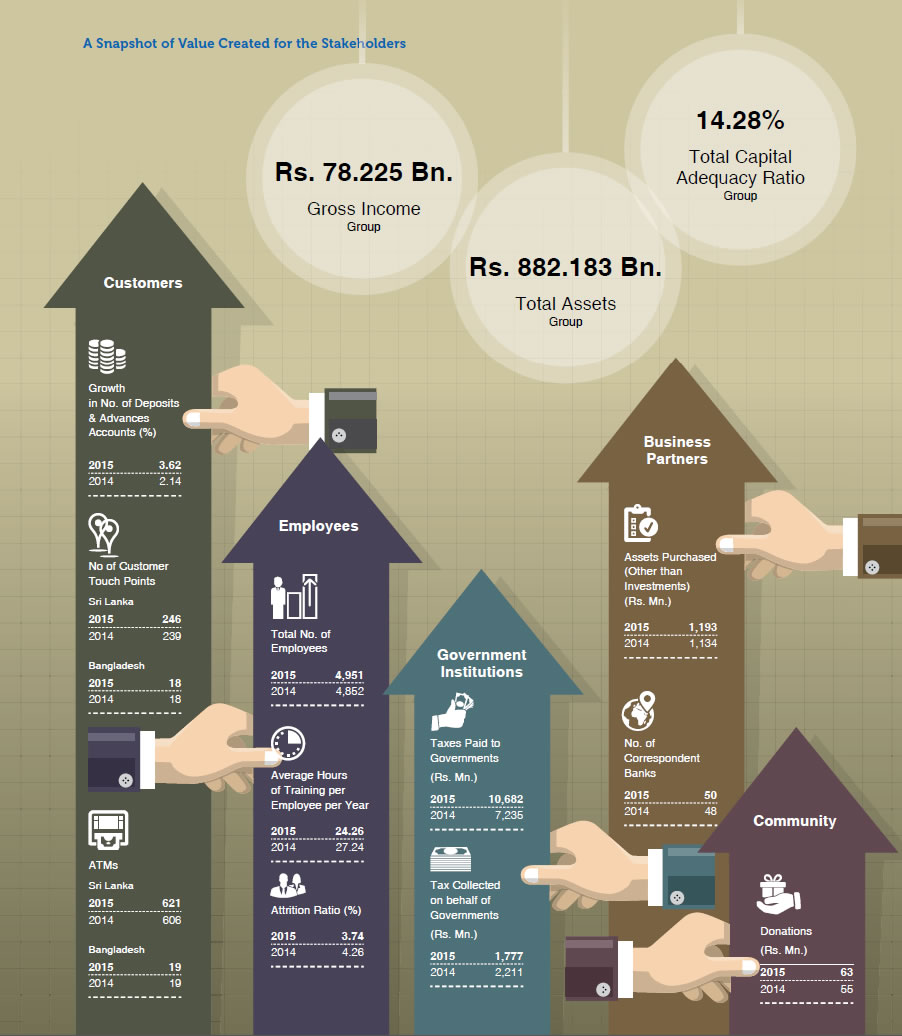
A Snapshot of Value Created for the Stakeholders
Performance Highlights
A strong commitment to sustainable growth