Managing Risk at Commercial Bank
Highlights
Governance and Management Approach
As a licensed commercial bank, we accept risk in our normal business and consequently, identifying, measuring, monitoring and managing risk is a core activity for the Bank. An organisation-wide risk management framework facilitates oversight of and accountability for risk at all levels of the organisation and across all risk types. Key elements of the Bank’s Integrated Risk Management Framework are as follows:
- Risk Governance
- Risk Appetite
- Risk Management Tools
- A Culture of Risk Awareness
The Risk Governance Structure of the Bank is given in Figure 10.
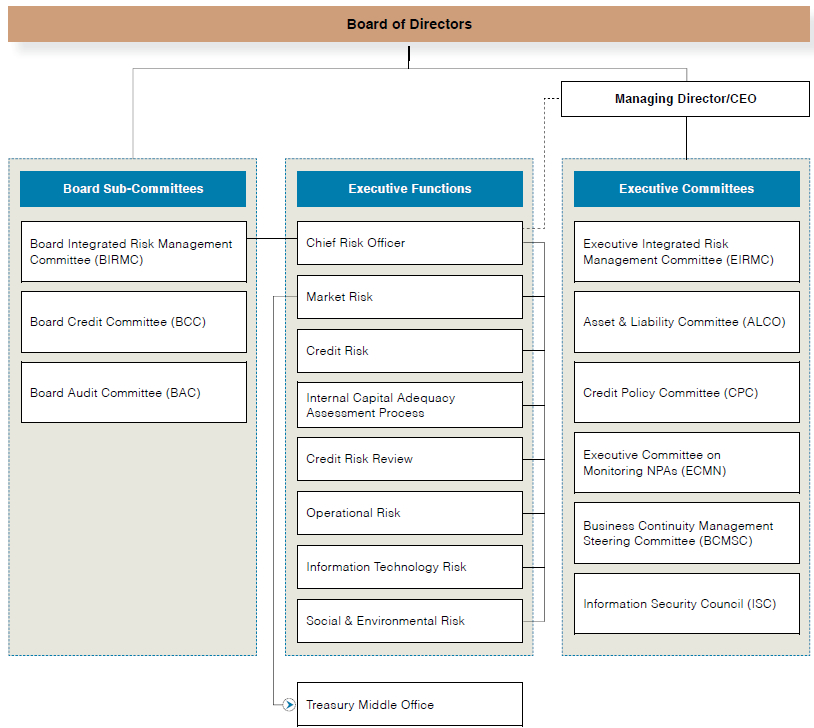
Figure - 10
Role of the Board and Board Sub-Committees
The Board of Directors bears the ultimate responsibility for oversight of risk management of the Bank and determines the risk appetite and reviews the governance structure, policy framework, risk management processes and other matters related to the effective management of risk on a regular basis.
The Board evaluates the effectiveness of risk management of the Bank on a regular basis and receives reports, explanations, clarifications and presentations from management in this regard. It also commissions investigations and initiates appropriate remedial action in instances where the Bank has incurred significant losses, breached risk appetite or incurred fines by regulators.
The Board is assisted in discharge of its duties with regard to management of risk by the Board Integrated Risk Management Committee (BIRMC) whose composition, Terms of Reference and activities are set out in the Board Integrated Risk Management Committee Report.
Board Credit Committee (BCC) assists the Board of Directors in defining the Credit Policy Framework and provides direction on the lending operations in line with the risk appetite of the Bank thus leading to a healthy loan portfolio.
Board Investment Committee (BIC) is entrusted with the overseeing of the overall investment strategy of the Bank. The Committee achieves this task by reviewing the market risk relating to investments undertaken by the Bank and providing guidance in managing the investment portfolio in accordance with the Investment Policy.
Board Audit Committee (BAC) assists the Board by evaluating the adequacy, efficiency and effectiveness of risk management measures, internal controls and governance processes in place to avoid, mitigate or transfer current and evolving risks. The Chairpersons of the BAC, BCC, BIC, Related Party Transactions Review Committee (RPTRC) and the Board Technology Committee (BTC) also provide feedback to the Board on aspects of risk management which fall within their Terms of Reference facilitating a holistic view of the effectiveness of risk management at Board level. Additionally, the Board Human Resources and Remuneration Committee (HRRC) ensures that relevant financial risk input is considered in determining levels of compensation encouraging compliance with the risk appetite approved by the Board.
Capital Management is a key focus area for the Board, who approves the Internal Capital Adequacy Assessment Process (ICAAP) and submissions to the CBSL in this regard. The Board and the BIRMC are monitoring the progress on the Bank’s implementation of ICAAP. They have participated in several presentations to fully understand the impact of developments in this regard and the related benefits, risks and opportunities. Additionally, external consultants have been engaged at the initial stages to facilitate a smooth transition and build capacity within the Bank.
During the year, the Board and the BIRMC reviewed risk management reports presented by the Chief Risk Officer and compliance reports from the Compliance Officer to evaluate the effectiveness of risk management in the Bank.
The Board continues to invest time and resources to understand the impact on risk management arising from the business and regulatory environment in order to provide informed inputs to strategy and policy formulation.
Management Committees
Executive management responsibility for managing risk is spearheaded by the Executive Integrated Risk Management Committee (EIRMC) and the following management committees, whose composition and key functions are given on the section ‘How We Govern’.
- Asset and Liability Committee (ALCO)
- Credit Policy Committee (CPC)
- Executive Committee on Monitoring NPAs (ECMN)
- Business Continuity Management Steering Committee (BCMSC)
- Information Security Council (ISC)
These committees carry out independent risk evaluations using both quantitative and qualitative criteria with the assistance of the Integrated Risk Management Department (IRMD) of the Bank. Decisions and discussion points on regular and ad-hoc reports reviewed by these committees are shared with Line Managers and Senior Management to ensure effective communication of material issues and initiate deliberation and necessary action. The EIRMC co-ordinates communication with the BIRMC and ensures that risk is managed within the defined risk appetite in accordance with the risk management policies and procedures approved by the Board.
Three Lines of Defence
The Bank deploys a ‘three lines of defence’ governance model (Figure 11) which facilitates accountability and transparency through clear identification and segregation of roles.
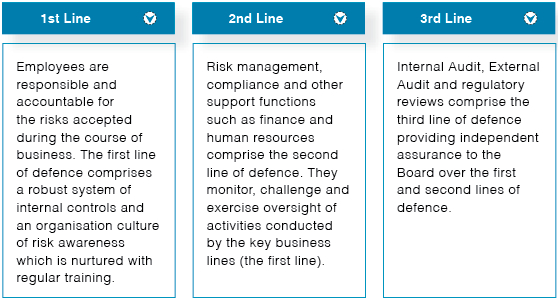
Figure 11
Risk Appetite
The Board has set in place a Risk Appetite Statement which clearly identifies the aggregate quantum of risk the Bank is willing to assume in different areas of business in achieving its strategic objectives.
Regulatory requirements, strategic goals, capital adequacy and other prudential factors have been considered by the Board in drawing up the Risk Appetite Statement to facilitate creation of sustainable value to stakeholders whilst ensuring compliance in an efficient manner.
Figure 12
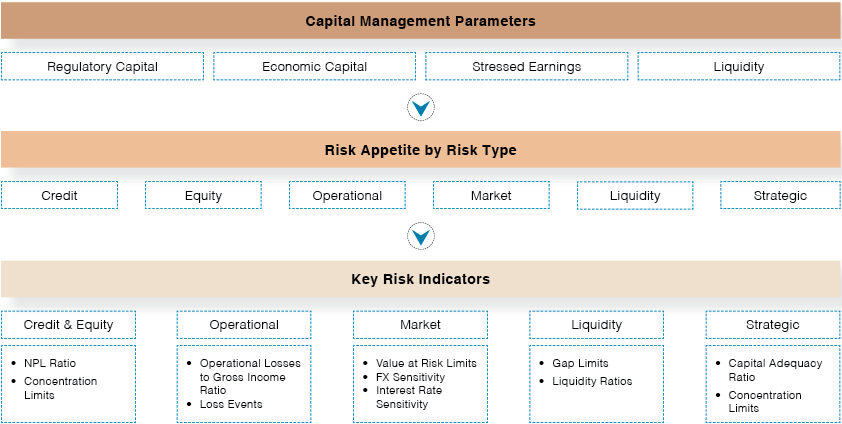
Figure 13
Risk Management Tools
Risk management tools facilitate identification, measurement, evaluation, monitoring and management of risk (Figure 14).
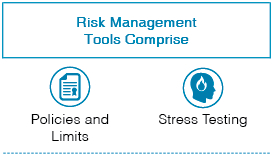
Figure 14
Risk measurement, monitoring and reporting is the responsibility of the Risk Management Function which is provided with appropriate opportunities for refining their skills with training and development programmes. They are strongly supported with state-of-the-art IT systems which enable extraction of data, analysis and modelling. Regular and ad-hoc reports are generated for review by Senior Management, Management Committees and Board who rely on these for evaluating performance and providing strategic direction. The reports provide information on aggregate measures of risks across products and portfolios which are compared with agreed policy limits providing a clear picture of the amounts, types and sensitivities of the risks monitored by the Bank.
The Bank’s Risk Management Policy addresses the risks managed by the Bank in compliance with the Banking Act Direction No. 07 of 2011 – Integrated Risk Management Framework for Licensed Banks which in turn is based on the Basel II Framework. This key document clearly defines the objectives, outlines, priorities, processes and roles of the Board and Management in managing risk at the Bank. The Risk Appetite Statement forms an integral part of the policy framework which is reviewed by the Board on an annual basis.
Stress testing is done at individual risk level and at entity level to estimate the potential impact on earnings, capital and liquidity due to changes in different market conditions and other risk factors. Results of stress testing are used for decision-making processes for credit risk appetite, market risk limits, capital and funding and are also integrated into the strategic and financial planning processes. Development, approval and review of stress tests are the responsibility of the EIRMC and the BIRMC.
Regulatory Environment
The overall Bank exposure including overseas operations is compliant with the regulatory framework of the CBSL. In addition, Bangladesh operation is compliant with Bangladesh regulatory framework and the Bank will comply with the regulatory frameworks of Myanmar and Maldives with regard to the operations in these countries.
Risks
Our business is exposed to a number of risks which have the potential to impact our ability to achieve pre-determined strategic goals including our financial performance. Whilst some risks can be managed by the Bank, there are other key risks that need to be monitored in order to assess their impacts although the Bank is unable to manage these risks (Figure 15). These include the following:
Macroeconomic Risks
The economic and market conditions of the countries we operate in have a direct impact on our performance which are in turn impacted by global markets, events and trends. These include the following risks:
- Global economic growth and in particular, economic growth in principal export markets for Sri Lanka
- Geopolitical risks impacting principal trading partners
- Commodities markets which impact corporate earnings and external trade
- Structural reforms to regulate or stimulate economic activity including fiscal and monetary policy
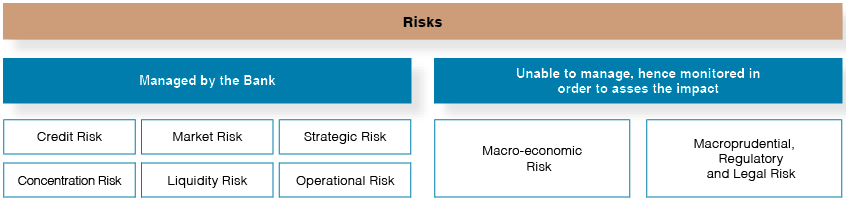
Figure 15
Macroprudential, Regulatory and Legal Risks
- Unfavourable developments in the financial services sector globally giving rise to increased regulation in Banking sector
- Increased regulations of the financial services sector in the countries we operate in
- Tax-related risks in countries we operate in
Risk management committees receive regular reports on trends and analysis of these risks to support decision making at operational and strategic levels.
The Bank manages the following principal risks identified as having a material impact on our ability to create value for our stakeholders:
- Credit Risk
- Concentration Risk
- Market Risk
- Liquidity Risk
- Operational Risk
- Strategic Risk
Credit Risk
Credit Risk is defined as the potential loss that could arise if a counterparty or customer fails to meet an obligation under a contract. It arises mainly from direct lending activities which are reflected on the Balance Sheet and from transactions facilitating trade such as Letters of Credit, Guarantees, Documents Against Acceptance etc., which are Off-Balance Sheet. Credit risk is comprised of counterparty risk, concentration risk and settlement risk.
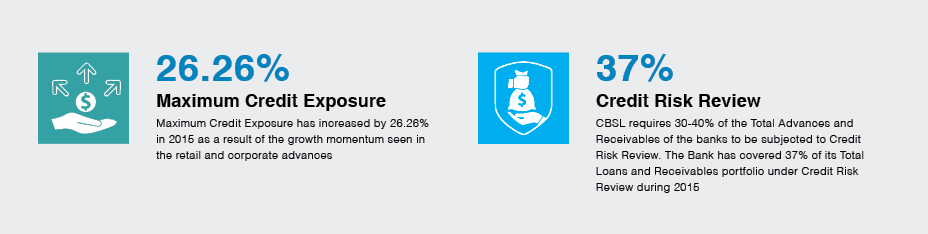
Credit risk is present across most of our Balance Sheet and in contingent liabilities as shown in Table 6. However, losses are mainly incurred in loans and receivables to Banks, loans and receivables to Other Customers (Graph 10) and Financial Investments. Therefore, the credit risk commentary focuses primarily on these items.
Maximum credit exposure increased by 26.26% as both retail banking and corporate banking grew their portfolios. Consequently, the amount of loan impairment charges has increased by 22% during the year. Further, the provision for impairment as a percentage of gross loans and receivables has declined due to effective credit risk management, which is further evidenced from the lower NPL ratio of the Bank. However, the Bank has adopted a more stringent approach towards assessment of individual impairment which resulted in an increase in individually impaired loan portfolio (Graph 11).
Maximum Credit Exposure
| 2015 | 2014 | ||||
| Maximum Exposure Rs. Mn. | % | Maximum Exposure Rs. Mn. | % | ||
| Carrying Amount of Credit Exposures | |||||
| Loans and receivables to other customers | 508,115 | 39.0 | 405,431 | 39.4 | |
| Loans receivables to banks | 601 | 0.0 | 551 | 0.1 | |
| Financial investments | 269,625 | 21.0 | 270,971 | 26.4 | |
| 778,341 | 676,953 | ||||
| Off Balance Sheet Maximum Exposures | |||||
| Lending commitments | 153,980 | 12.0 | 106,560 | 10.4 | |
| Financial guarantees | 365,875 | 28.0 | 244,636 | 23.7 | |
| 519,855 | 351,196 | ||||
| Maximum credit exposure | 1,298,196 | 100.0 | 1,028,149 | 100.0 | |
| Individually Impaired loans | 11,747 | 6,549 | |||
| Impaired loans as a % of gross loans and receivables | 2.23 | 1.55 | |||
| Provision for impairment individual and collective | 18,052 | 16,956 | |||
| Net carrying amount of loans and receivables | 508,115 | 405,431 | |||
| Provisions as a percentage of gross loans and receivables | 3.43 | 4.01 | |||
| Loan impairment charge individual and collective | 3,905 | 3,190 | |||
Table - 6
Gross Loans & Receivables to Other CustomersGraph - 10 Impairment ChargeGraph - 11Management Processes
Management of credit risk is critical to the Bank and our approach is to enhance value through credit risk management going beyond mere regulatory compliance. It is managed through the Credit Risk Management Framework approved by the Board which comprises the following:
- A comprehensive suite of policies and procedures – This includes a defined delegation of authority for approval of credit and committees to address specific aspects of credit risk management with a view to maintaining the quality of credit within the defined risk appetite. The Bank’s Social and Environmental Management Systems (SEMS) Policy integrated to the Bank’s pre-sanction risk evaluation process and Credit Risk Review Framework that covers the post disbursement review, enable maintenance of a high quality lending portfolio are encapsulated in the Credit Policy and Lending Guidelines of the Bank. The Credit Policy Committee of the Bank recommends amendments to the policy from time to time based on industry practices, operational efficiency factors and evolving risk landscape.
- Risk Appetite Statement – This includes limits on maximum exposures to industry sectors, products and geographies with reference to qualitative and quantitative criteria which encompass maturities and risk ratings. It also specifies High Risk and Prohibited Appetite which are reviewed on a regular basis and amended as deemed necessary. Proposals in the High Risk Category may be approved under exceptional circumstances which will take into account the business rationale and risk mitigants whilst proposals for Prohibited Appetite are not entertained under any circumstances.
- Risk Ratings – The Bank has in place a comprehensive risk rating system in compliance with Basel II Guidelines which is capable of representing diverse risk factors through a single point indicator and predicting the probability of default based on borrower and transaction specific criteria. These indicators facilitate measurement of risk in credit portfolios in an objective and consistent manner while supporting the Bank’s progression from the present Basel II Standardised Approach towards the more advanced Internal Ratings Based approaches for calculating the capital requirement for credit risk.
- Collateral Management and Valuation – The Bank obtains collaterals as a possible secondary recourse in the form of cash, marketable securities, properties, stocks, trade debtors, other receivables, machinery and equipment and other physical or financial assets. Clear guidelines are in place to determine the suitability of collateral in credit risk mitigation based on their different characteristics and valuation, to ensure the collaterals will continue to provide the anticipated secondary source of repayment in an eventuality. The Bank has a panel of appointed professional valuers in order to obtain valuation of the properties, machinery and vehicles taken as collaterals. Periodic estimation of values of collateral ensures that they will continue to provide the expected repayment source in an event where the primary source has not materialised. The collaterals vulnerable to frequent fluctuations in values are subject to stringent haircuts and/or more frequent valuations. The Bank also accepts personal and/or Corporate Guarantees, Guarantees from other banks and creditworthy bodies as collateral for credit facilities. The financial strength of guarantors as against their cash flows, net worth, etc. is taken into consideration to establish their capacity to repay the facilities in case of a default.
- Segregation of Credit Risk Management Functions – Credit risk management comprises three functional components with pre-sanction risk being monitored and evaluated by Credit Risk Management, post-sanction credit risk being monitored by the Credit Risk Review Function and the social and environment risk being monitored by the Environmental Risk Review Function. This facilitates a high degree of specialisation and honing of skills resulting in focussed and effective analysis supporting effective credit risk management. The Credit Risk Review Function has reviewed borrowers with an exposure upto 37% of total loans and receivables portfolio of the Bank during 2015.
- Independent Verification of Risk Assessments – The Credit Risk Management Function independently verifies that the proposals with exposures above identified threshold levels fall within the established Credit Risk Framework of the Bank and that they are in compliance with the internal as well as regulatory requirements.
- Credit Risk Monitoring – The Branch Credit Monitoring Department of the Bank which reports to Assistant General Manager – Credit Supervision and Recoveries independently monitors the advances portfolio for any signs of delinquency and supports the Lending Officers to maintain the quality of the loan book (Figure 16). The Credit Risk Management Function prepares monthly reports on Key Credit Risk Indicators (KCRIs) which include the loans and advances segmentation by business lines and products, risk rating, economic sectors, exposures, analysis of NPL portfolio and default ratios, analysis of high risk segments, concentration and cross border exposures etc. to assess risks of the advances portfolio in a holistic manner. These risks are analysed in an objective manner and compared with established policy parameters to ensure effective management of credit risk. A high level of granularity in analysis facilitates identification of portfolio characteristics, possible correlations between portfolios and environmental factors and comparison of trends across different lending portfolios leading to identification of emerging risks in individual portfolios and implementation of corrective action in a timely manner.
- Providing Direction to Business Line Managers – The credit monitoring process provides information on products, industries and other indicators of elevated risk, facilitating diversification into thriving economic segments whilst reducing the overall credit risk concentration and optimising returns.
- Internal Audit – Credit risk management processes are reviewed by Internal Audit to ensure that it is in compliance with regulatory requirements and the Bank’s policy framework.
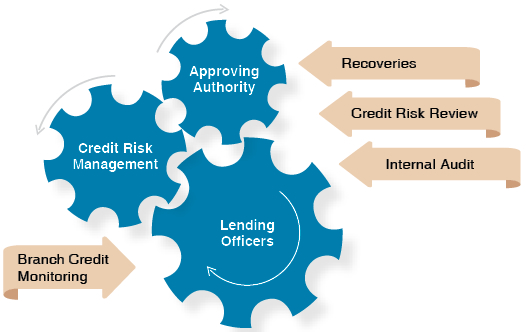
Figure - 16
Credit Risk Review
Default Risk
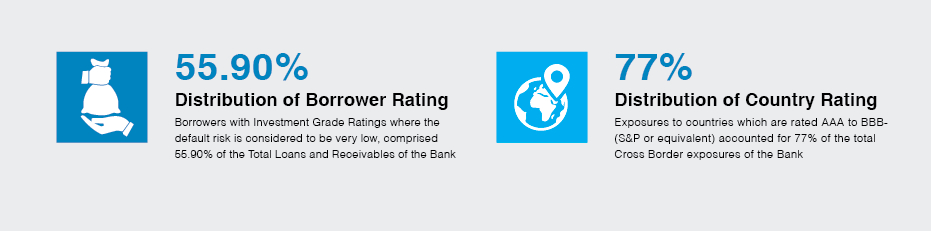
Default risk (defined as the potential loss due to borrowers’/counterparties’ inability or unwillingness to meet its obligations) moderated during the year as indicated by the improved risk ratings of the loans and receivables portfolio is reflected in the graphs 13 and 14. This is attributable to the efficacy of credit risk management processes which enabled channelling of lending to economically thriving industry sectors, improved risk assessments of credit proposals and effective credit monitoring enabling early interventions. Risk profile of the lending portfolio of the Bank indicates an increase in the investment grade borrowers during 2015.
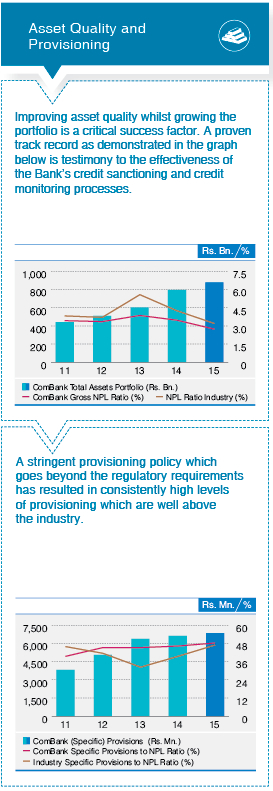
Age Analysis of Past Due LoansGraph - 12 Risk Ratings-Wise Distribution of Loans & Receivables – 2015Graph - 13 Risk Ratings-Wise Distribution of Loans & Receivables – 2014Graph - 14The allowance for individual and collective impairment increased by 6.46% during the year due to strong growth in retail banking and corporate banking portfolios. Moderation of default risk made it permissible to reduce the impairment provision coverage within the Bank’s risk appetite. Allowance for individual and collective impairment by industry sectors is given in Table 7. Individual impairment of tourism and hospitality trade is high mainly due to two exposures which are being closely monitored and recovery probability is predicted as favourable. The provision cover computed under time based provisioning policy of the CBSL guidelines remains well above industry levels as depicted in Asset Quality and Provisioning illustration given at the beginning of this report as the Bank adopts stringent policies for provisioning which go beyond the regulatory requirements.
Individual/Collective Impairment Distribution
| Country/Industry Sector | Past Due Advances (According to SLFRS Classification) Rs. ’000 | Allowance for Individually Impaired Loans Rs. ’000 | Allowance for Collective Impairment Rs. ’000 | Amount Written off Rs. ’000 | ||||
| Exports | 1,782,376 | 167,109 | 854,701 | 4,896 | ||||
| Imports and trading | 3,476,350 | 764,604 | 1,533,759 | 6,136 | ||||
| Wholesale and retail trading | 1,374,062 | 126,680 | 685,733 | 2,271 | ||||
| Construction industry | 2,222,731 | 443,721 | 291,291 | 2,147 | ||||
| Any other commercial activity | 1,437,100 | 13,694 | 468,953 | 1,547 | ||||
| Industries – mfg for local market | 3,087,162 | 886,936 | 1,468,691 | 34,834 | ||||
| Agricultural activity | 2,282,998 | 95,337 | 963,757 | 35,891 | ||||
| Housing & property development | 901,279 | 464,854 | 271,979 | 2,163 | ||||
| Tourism and hospitality trade | 4,092,162 | 1,520,466 | 394,890 | 1,100 | ||||
| Personal | 3,972,745 | 229,922 | 2,672,751 | 221,062 | ||||
| Services | 2,302,197 | 126,629 | 1,797,916 | 31,137 | ||||
| Holding companies | 851,298 | 997 | 87,896 | 165 | ||||
| Finance & insurance industry | 69,709 | 47,157 | 211,252 | 49 | ||||
| State institutions | 20,875 | – | 100,750 | – | ||||
| Others | 266,065 | 14,779 | 173,775 | 4,432 | ||||
| Bangladesh | – | 467,074 | 703,499 | – | ||||
| 28,139,109 | 5,369,960 | 12,681,595 | 347,830 |
Table - 7
Concentration Risk
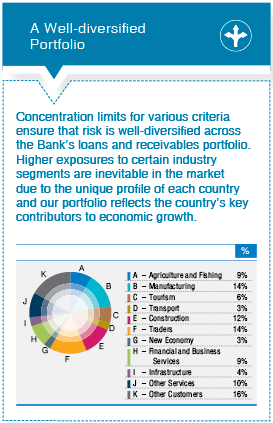
Concentration risk is managed by diversification of risk across industry sectors, products, counterparties and geographies. The Bank’s Risk Appetite Statement defines the limits for these segments and exposures are monitored by the Board, BIRMC, EIRMC and the CPC to ensure compliance and also make recommendations on modifications to specified limits taking into consideration trends and events shaping the business environment. Total industry-wise credit exposure as at end of 2015 is graphically depicted on this section.
An analysis of the loans and receivables portfolio given on this section reflects a well-diversified portfolio with significant exposures to – manufacturing, trade, construction and other customers which are the country’s thriving economic segments.
An analysis of loans and receivables by product (Graph 15) also reflects the effectiveness of the Bank’s credit policies with risks being well-diversified across the Bank’s range of credit products with relatively high exposure of 29.74% to long term loans which is rigorously monitored and risks mitigated with collateral.
Product-wise Analysis of Loans & Receivables to Other Customers as at December 31, 2015Graph - 15A geographical analysis reflects a high concentration of loans (Graph 16) in the Western Province which is due to concentration of economic activity and the Head Offices of borrowing entities being located in the Western Province. It is noteworthy that there is a significant decline in the exposure to the Western Province from 71.73% in 2014 to 69.93% in 2015 mainly due to growth of business volumes of branches located outside the Western Province.
Geographical Analysis of Loans & Receivables to Other Customers as at December 31, 2015Graph - 16Counterparty Risk
Counterparty risk is managed through single borrower limits and group borrowing limits which have sub-limits for products and other criteria as well. The Bank has established more stringent limits for individual and Group exposures as compared to Single Borrower Exposure thresholds stipulated by the regulator which provides the Bank with a greater comfort in managing concentration levels.
A key component of counterparty risk is loans and receivables to Banks, both local and foreign entities, managed through a specific set of policies and procedures which include comprehensive limits. Exposures to this segment are monitored regularly to ensure compliance and there is a rigorous scrutiny of market, financial and other information relating to these counterparties throughout the year with limits revised to reflect latest information whenever deemed necessary.
The Concentration of Counterparty Bank Exposures in Sri Lanka as at December 31, 2015 (Fitch Ratings-Wise)Graph - 17 The Concentration of Counterparty Bank Exposures in Bangladesh as at December 31, 2015 (CRAB* Ratings-Wise)Graph - 18The analysis uses Fitch Ratings for local banks in Sri Lanka and Credit Ratings Agency of Bangladesh (CRAB) for local banks of Bangladesh (Equivalent CRISL/Alpha ratings have been used where CRAB ratings are not available). Exposures for local banks in Sri Lanka rated AAA to A category stood at 80% (Graph 17) while 100% of exposure of local banks in Bangladesh consisted of AAA to A rated counterparty Banks (Graph 18).
Cross-Border Risk
Cross-border risk is the risk that the Bank will not be able to obtain payment from its customers or third parties on their contractual obligations as a result of certain action taken by foreign Governments, mainly relating to convertibility and transferability of foreign currency. Cross-border assets comprise loans and receivables to banks and other customers, balances with banks and Central Banks, trade and other bills and acceptances which predominantly relate to short term money market activities.
Total cross-border exposure is only 4% of total assets of the Bank (Graph 20). The Bank has exposures to cross-border through a spread of countries which primarily include Maldives, Bangladesh, India, USA, Singapore, Seychelles, UK, Germany, Hong Kong etc.
The Concentration of Cross-border Exposure (Sri Lanka and Bangladesh Operations) S & P Ratings-Wise as at December 31, 2015Graph - 19 Cross-border Exposure of the Bank (Sri Lankan & Bangladesh Operations)Graph - 20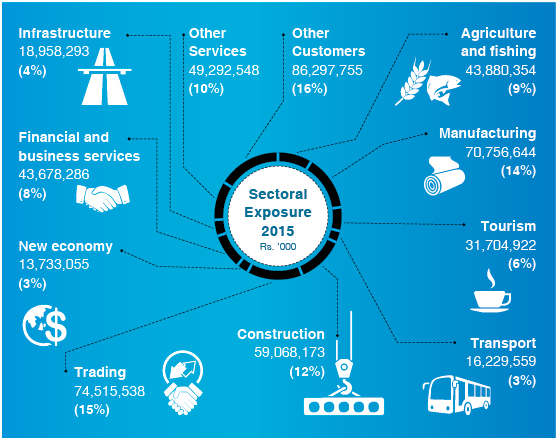
Figure - 17
Market Risk
Market risk is the potential of an adverse impact on the Bank’s earnings or capital due to changes in interest rates, foreign exchange rates, commodity prices or equity and debt prices. The Bank’s normal operations include dealing in financial products which expose the Bank to market risk in varying degrees.
Most items on the Balance Sheet are subject to some of the following elements of market risk:
- Interest Rate Risk (IRR)
- Foreign Exchange (FX) Risk
- Equity Risk (The Bank’s exposure is negligible)
- Commodity Risk (The Bank does not have any exposure to Commodity Risk)
Interest Rate Risk is the exposure of the Bank’s financial condition against movements in interest rates. Extreme upward or downward movements in interest rates could pose a severe threat to the Bank’s Net Interest Income and also affect the underlying value of assets, liabilities and Off-Balance Sheet items. The main types of IRR to which the Bank is exposed are re-pricing risk, yield curve risk and basis risk.
- Re-pricing Risk occurs due to differences in amounts of interest earning assets and interest bearing liabilities getting re-priced at the same time or due to timing differences in the fixed rate maturities and appropriately re-pricing of floating rate assets, liabilities and Off-Balance Sheet instruments. The Bank monitors this risk through internally set re-pricing gap limits and interest rate sensitivity limits on a regular basis.
- Yield Curve Risk arises due to unanticipated changes in shape and gradient of the yield curve, while basis risk arises due to differences in the relative movement of rate indices used for pricing instruments with similar characteristics, both of which contribute to IRR of the Bank. These risks are managed by appropriately re-balancing and/or re-pricing of portfolios.
FX Risk is the possible impact on earnings or capital, due to movements in exchange rates arising out of maturity mismatches in foreign currency positions other than the base currency, Sri Lankan Rupee (LKR).
Bank has set stringent risk tolerance limits for individual currency exposures as well as aggregate exposures within regulatory limits to ensure that potential losses due to fluctuations in FX rates are minimised and within the Bank’s risk appetite.
Equity and Debt Price Risks arise due to changes in prices and volatilities of individual equities/debts. Mark to market calculations are carried out daily and quarterly for Held-for-trading and Available-for-sale portfolios respectively, although the Bank’s exposure to this risk is negligible.
Commodity Price Risks result from exposures to changes in prices and volatilities of individual commodities. However, the Bank does not have any exposure in Commodity Risk.
Management of Market Risk
The Market Risk Management Framework of the Bank provides guidance on appropriate management of market risk within the overall risk appetite so that adverse changes in market risk parameters, do not materially impact the Bank’s profitability, capital or the risk profile. Key elements include:
- A Robust Risk Governance Structure – Market risk is monitored by BIRMC, EIRMC and ALCO which are responsible for formulating policy in this regard including setting the parameters of the Risk Appetite Statement. EIRMC is the principal management committee responsible for monitoring market risk exposure and initiating appropriate action to optimise overall market risk exposures within the defined risk appetite. Market Risk Management Unit (MRMU) of the IRMD is responsible for co-ordinating and performing daily market risk management activities including measuring, monitoring and reporting of market risk exposures, and reviewing the Bank’s market risk-related policies and exposure limits at least annually. It also provides independent reviews on market risks associated with new investment proposals and products, thus facilitating efficient decision-making through optimising risk-return trade off. The Treasury Middle Office (TMO) is an integral part of MRMU and functions independently from both the Treasury Front Office (i.e. trading unit) and Treasury Back Office (i.e. settlement unit). TMO independently monitors, measures and analyses exposures as per the comprehensive limit framework pertaining to Treasury transactions. Further, it reports on Management Action Triggers (MATs), which alert of imminent limit breaches and recurring loss events, to initiate preventive measures to mitigate potential losses.
- A Comprehensive Suite of Policies – Policies covering various aspects of market risk which include Market Risk Management Policy, Asset and Liability Management (ALM) Policy, Foreign Exchange (FX) Risk Management Policy, Derivative Policy, Treasury Policy and Stress Testing Policy define exposure limits and procedures for transactions.
- Market Risk Limits – These are regularly reviewed by ALCO and EIRMC and revised to narrower bands than specified in the Risk Appetite Statement to control the impact of market dynamics arising from elevated risk levels.
- Management Action Triggers – These are risk thresholds that trigger specific actions to safeguard the market risk exposures of the Bank within the levels specified in the Risk Appetite Statement.
- Risk Monitoring – ALCO is responsible for monitoring Asset and Liability gaps, composition and market trends to determine strategy, pricing of risk and funding requirements. The IRR of the Bank is measured independently and managed by Treasury in a consolidated manner through Funds Transfer Pricing (FTP) mechanism under the guidance of ALCO. Additionally, the Bank uses several tools such as gap analysis (income perspective) and duration analysis (value perspective) to monitor IRR on an ongoing basis taking into consideration re-pricing characteristics of all assets and liabilities of the Bank. The Bank assesses IRR exposure based on both the Earnings at Risk (EAR) approach focusing on the impact of interest rate changes on its near-term earnings and the Economic Value of Equity (EVE) approach, focusing on the value of the Bank’s net cash flows.
- Risk Assessment – The Bank uses a range of techniques including sensitivity analysis, stress testing, marking to market and Value-at-Risk (VaR) calculations to assess market risk across portfolios.
Market Risk Review
The Bank’s exposures to market risk analysed by Trading Book and Non-Trading Portfolios (or Banking Book) are set out in the Table 8:
| Carrying Amount Rs. Mn. | Trading Portfolio Rs. Mn. | Non-Trading Portfolio Rs. Mn. | ||||
| Assets Subject to Market Risk | ||||||
| Cash & cash equivalents | 6,012 | – | 6,012 | |||
| Balances with Central Banks | 8,146 | – | 8,146 | |||
| Placements with banks | 17,194 | – | 17,194 | |||
| Securities purchased under resale agreements | 8,002 | – | 8,002 | |||
| Derivative financial assets | 4,118 | 4,118 | – | |||
| Other financial instruments – Held for trading | 7,656 | 7,656 | – | |||
| Loans & receivables to banks | 601 | – | 601 | |||
| Loans & receivables to other customers | 508,115 | – | 508,115 | |||
| Financial Investments – Available-for-sale | 204,244 | – | 204,244 | |||
| Financial investments – loans and receivables | 57,724 | – | 57,724 | |||
| Total | 821,812 | 11,774 | 810,038 | |||
| Liabilities Subject to Market Risk | ||||||
| Due to banks | 30,319 | – | 30,319 | |||
| Derivative financial liabilities | 1,891 | 1,891 | – | |||
| Securities sold under repurchase agreements | 112,385 | – | 112,385 | |||
| Due to other customers/Deposits from customers | 624,102 | – | 624,102 | |||
| Other borrowings | 9,986 | – | 9,986 | |||
| Subordinated liabilities | 11,973 | – | 11,973 | |||
| 790,656 | 1,891 | 788,765 |
Table – 8
The Bank’s market risk arises mainly from the Non-Trading Portfolio (Banking Book) which accounts for 92.07% of the total assets and 97.44% of the total liabilities subject to market risk. The Bank’s exposure to market risk arises mainly from Interest Rate Risk (IRR) and Foreign Exchange (FX) Risk as the Bank does not have any exposure to commodity-related price risk and only a negligible exposure on equity and debt price risk which was less than 8.00% of the total risk weighted exposure for market risk.
Interest Rate Risk (IRR)
Market Risk Portfolio Analysis
Interest Rate Sensitivity Gap Analysis of Assets and Liabilities is given below:
| Up to 1 Month Rs. Mn. | 1-3 Months Rs. Mn. | 3-6 Months Rs. Mn. | 6-12 Months Rs. Mn. | 1-3 Years Rs. Mn. | 3-5 Years Rs. Mn. | Over 5 Years Rs. Mn. | Non- Sensitive Rs. Mn. | Total Rs. Mn. | ||||||||||
| Cash on hand | – | – | – | – | – | – | – | 15,873 | 15,873 | |||||||||
| Deposits with Central Banks | 2,745 | – | – | – | – | – | – | 20,075 | 22,820 | |||||||||
| Balances due from head office, affiliates and own branches |
– | – | – | – | – | – | – | – | – | |||||||||
| Balances due from other banks | 22,497 | 4,829 | – | – | – | – | – | – | 27,326 | |||||||||
| Investments | 57,897 | 4,265 | 197 | 14,217 | 95,670 | 45,278 | 56,229 | 2,066 | 275,821 | |||||||||
| Bills of exchange | 11,242 | – | – | – | – | – | – | – | 11,242 | |||||||||
| Overdrafts | 52,535 | 11,908 | 3,903 | 8,969 | 2 | – | – | – | 77,318 | |||||||||
| Loans and advances | 175,975 | 40,188 | 39,097 | 67,135 | 60,537 | 33,514 | 2,433 | – | 418,879 | |||||||||
| NPLs | – | – | – | – | 67 | 27 | 33 | 629 | 756 | |||||||||
| Fixed assets | – | – | – | – | – | – | – | 10,435 | 10,435 | |||||||||
| Net inter-branch transactions | – | – | – | – | – | – | – | – | – | |||||||||
| Accrued interest | – | – | – | – | – | – | – | 9,400 | 9,400 | |||||||||
| Other assets | – | – | – | – | – | – | – | 6,265 | 6,265 | |||||||||
| Reverse repos | 8,002 | – | – | – | – | – | – | – | 8,002 | |||||||||
| FRAs | – | – | – | – | – | – | – | – | – | |||||||||
| SWAPs | – | – | – | – | – | – | – | – | – | |||||||||
| Futures | – | – | – | – | – | – | – | – | – | |||||||||
| Options | – | – | – | – | – | – | – | – | – | |||||||||
| Others | – | – | – | – | – | – | – | – | – | |||||||||
| Total Rate Sensitive Assets (RSA) | 330,893 | 61,190 | 43,198 | 90,321 | 156,276 | 78,819 | 58,696 | 64,744 | 884,137 | |||||||||
| Demand deposits | – | – | – | – | – | – | – | 57,986 | 57,986 | |||||||||
| Savings deposits | 241,928 | – | – | – | – | – | – | – | 241,928 | |||||||||
| Time deposits | 46,334 | 75,940 | 66,315 | 94,524 | 12,684 | 8,790 | 10,434 | – | 315,020 | |||||||||
| Other deposits | – | – | – | – | – | – | – | – | – | |||||||||
| Balances due to head office, affiliates and own branches | – | – | – | – | – | – | – | – | – | |||||||||
| Balances due to other banks | 6,727 | 10,431 | 2,162 | 10,090 | – | – | – | – | 29,411 | |||||||||
| Certificates of deposit | 120 | 15 | 45 | 89 | 151 | – | – | – | 420 | |||||||||
| Other borrowings | 2,227 | 5,607 | – | – | – | – | 2,056 | – | 9,889 | |||||||||
| Net Inter-Branch transactions | – | – | – | – | – | – | – | – | – | |||||||||
| Bills payable | – | – | – | – | – | – | – | – | – | |||||||||
| Interest payable | – | – | – | – | – | – | – | 10,012 | 10,012 | |||||||||
| Provisions (Others) | – | – | – | – | – | – | – | – | – | |||||||||
| Capital | – | – | – | – | – | – | – | 23,255 | 23,255 | |||||||||
| Reserves | – | – | – | – | – | – | – | 46,912 | 46,912 | |||||||||
| Retained earnings | – | – | – | – | – | – | – | 4,490 | 4,490 | |||||||||
| Subordinated debt | 10,811 | – | 505 | 467 | – | – | – | – | 11,784 | |||||||||
| Other liabilities | – | – | – | – | – | – | – | 19,823 | 19,823 | |||||||||
| Repos | 71,140 | 19,080 | 11,243 | 11,413 | 332 | – | – | – | 113,207 | |||||||||
| FRAs | – | – | – | – | – | – | – | – | – | |||||||||
| Futures | – | – | – | – | – | – | – | – | – | |||||||||
| SWAPs | – | – | – | – | – | – | – | – | – | |||||||||
| Options | – | – | – | – | – | – | – | – | – | |||||||||
| Total Rate Sensitive Liabilities (RSL) | 379,288 | 111,072 | 80,270 | 116,583 | 13,167 | 8,790 | 12,490 | 162,478 | 884,137 | |||||||||
| Period gap | (48,395) | (49,882) | (37,073) | (30,431) | 143,109 | 70,029 | 46,206 | |||||||||||
| Cumulative gap | (48,395) | (98,276) | (135,349) | (165,780) | (18,501) | 51,528 | 97,734 | |||||||||||
| RSA/RSL | 1 | 1 | 1 | 1 | 12 | 9 | 5 |
Table – 9
Table 9 is prepared by stratifying Rate Sensitive Assets (RSA), Rate Sensitive Liabilities (RSL) and Off-Balance Sheet items into various time bands according to maturity (if fixed rates) or time remaining to their next re-pricing
(if floating rate). The gap between RSA and RSL indicates the vulnerabilities the Bank is exposed to with changing interest rate scenarios in the market.
Impact on Net Interest Income (NII) due to rate shocks on LKR and FCY is continuously monitored to ascertain the Bank’s vulnerability to sudden interest rate movement [Refer Note 67.3.2 (b) to the Financial Statements]. Table 10 depicts the sensitivity of projected NII to interest rate changes for 2014 and 2015 which demonstrates an increased/decreased sensitivity due to the conscious decision of the Bank to rebalance its fixed income securities portfolio.
Sensitivity of projected NII
| 2015 | 2014 | |||
| 100 bp Parallel Up Rs. ’000 | 100 bp Parallel Down Rs. ’000 | 100 bp Parallel Up Rs. ’000 | 100 bp Parallel Down Rs. ’000 | |
| As at December 31, | 363,173 | (362,303) | 494,488 | (495,461) |
| Average for the year | 336,601 | (335,541) | 751,326 | (753,968) |
| Maximum for the year | 469,161 | (468,336) | 893,537 | (901,327) |
| Minimum for the year | 267,117 | (266,063) | 494,488 | (495,461) |
Table – 10
The Bank conducts regular stress tests on Interest Rate Risk in Banking Book (IRRBB) encompassing changing positions and new economic variables together with specific stress scenarios. Change in value of the Fixed Income Securities (FIS) portfolio in Held-for-Trading (HFT) category due to abnormal market movements is measured using both Economic Value of Equity (EVE) and Earnings at Risk (EAR) perspectives. Results of stress test on IRR are analysed to identify the impact of such scenarios on Bank profitability and capital.
Foreign Exchange (FX) Risk
Foreign exchange risk is the possible impact on earnings or capital, due to movements in exchange rates arising out of maturity mismatches in foreign currency positions other than the base currency, Sri Lankan Rupee (LKR). The Bank has set stringent risk tolerance limits for individual currency exposures as well as aggregate exposures within the regulatory limits to ensure that potential losses arising out of fluctuations in FX rates are minimised and maintained within the Bank’s risk appetite.
USD/LKR exchange rate fluctuated between a low of Rs.131.25 and a high of Rs.144.25 (Source: Bloomberg) during the year under review and the annual Rupee depreciation was recorded at approximately 9.03%. Table 11 indicates the Bank’s exposure to FX risk as at December 31, 2015.
FX Position as at December 31, 2015
| Net Open Position | Overall Exposure in Respective Foreign Currency | Overall Exposure in LKR ’000 | ||||
| United States Dollar | 1,096 | 1,877 | 270,602 | |||
| Great Britain Pound | 46 | 15 | 3,171 | |||
| Euro | (58) | (31) | (4,886) | |||
| Japanese Yen | (420) | 5,848 | 6,999 | |||
| Indian Rupee | 0 | 0 | 0 | |||
| Australian Dollar | (33) | 1 | 86 | |||
| Canadian Dollar | (0) | 7 | 716 | |||
| Other currencies in US $ | 44 | 333 | 47,951 | |||
| Total exposure US $ | 1,117 | 2,252 | 324,639 | |||
| Total capital funds as at December 31, 2015 | 79,687,972 | |||||
| Total exposure as a % of capital funds as at December 31, 2015 | 0.41% |
Table – 11
Stress testing is conducted on Net Open Position (NOP) by applying rate shocks ranging from 6% to 15% in order to estimate the impact on profitability and capital adequacy of the Bank. The impact of a 1% change in exchange rate on the Net Open Position will result in a profit/loss of Rs. 126.26 Mn. on the positions as at December 31, 2015 (Refer Note 67.3.3 to the Financial Statements). In addition, the Bank continuously monitors the sensitivity of NOP to exchange rate fluctuations.
Equity Risk
Equity price risks arise from exposures to changes in prices and volatilities of individual equities. Although the Bank’s exposure to this risk is negligible, mark-to-market calculations are conducted either daily or quarterly on Held-for-trading and Available-for-sale portfolios respectively, to identify the impact on profit due to changes in equity prices. The Bank has also commenced VaR calculations on equity portfolio. Table 12 summarises the impact of a shock of 10% on equity price on profit, Other Comprehensive Income (OCI) and equity: as at December 31, 2015. (Refer Note 67.3.4 to the Financial Statements)
| Held-for-Trading Rs. ’000 | Available-for-Sale Rs. ’000 | Total Rs. ’000 | ||||
| Impact on Income Statement | Impact on OCI | Impact on Equity | ||||
| Shock of 10% on equity price | ± 32,626 | ± 23,484 | ± 56,110 |
Table – 12
Liquidity Risk
Liquidity risk is the Bank’s inability to meet ‘On’ or ‘Off’ Balance Sheet contractual and contingent financial obligations as they fall due, without incurring unacceptable losses.
Banks are vulnerable to liquidity and solvency problems resulting from asset and liability mismatches. Therefore, the principal objective in liquidity risk management is to assess the need for funds to meet obligations and to ensure the availability of adequate funding to fulfil those needs at the appropriate time, both under normal and stressed conditions.
The Bank has maintained the following Liquid Asset Ratios as at December 31, 2015:
| DBU | OBC | |||
| Statutory Liquid Asset Ratio (SLAR) | 26.24% | 49.13% |
Table – 13
Managing Liquidity Risk
The nature of the Bank’s business entails continuous monitoring of liquidity risk in accordance with the Risk Management Framework within the parameters of the Risk Appetite of the Bank. Structures and processes in place for management of liquidity risk are described below:
- Structure – ALCO is the main management committee mandated with the implementation of liquidity risk management policies and procedures. These include establishing and monitoring liquidity targets, determining strategies and tactics to meet those targets, ensuring availability of sufficient liquidity for unanticipated contingencies by focusing on effective diversification in sources and tenors of funding, monitoring Off-Balance Sheet activity-related liquidity impact and diversifying deposit maturity base avoiding concentration of resources. The Board, BIRMC, ALCO and EIRMC regularly review reports of key liquidity risk indicators to ensure that they are within the agreed parameters.
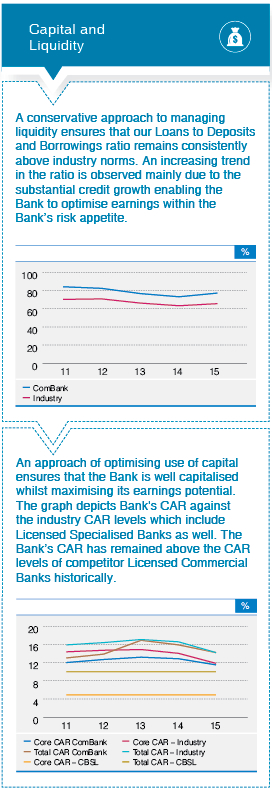
- Measurement – The Bank uses numerous methods to monitor its liquidity profile within both stock (based on key ratios) and flow (based on cash inflows and outflows in time bands) approaches. The range of key liquidity risk indicators used by the Bank to assess adequacy of its liquidity position includes, Statutory Liquid Asset Ratio (Table 13), Net Advances to Deposit Ratio, Dynamic and Static (Structural) Liquidity Gap Summary, Core Funding Ratio, Funding Concentration and Commitments Vs Funding Sources. Furthermore, the Bank has in place a more stringent internal limit for maintaining SLAR as compared to the minimum statutory requirement of 20% of total liabilities excluding contingent liabilities as well as appropriate levels of Liquidity Coverage Ratio (LCR) as per the Basel III Guidelines (Graph 21).
- Risk Mitigation – The Bank maintains an adequate margin of safety in high quality liquid assets and access to diverse funding sources such as inter-bank market, wholesale and retail repurchase agreements, assets and investments Available-for-sale and has contingency funding agreements with peer banks to meet liquidity requirements. This ensures availability of adequate liquidity to fund its existing asset base and growth whilst maintaining sufficient liquidity buffers to operate smoothly under varying market conditions including any short, medium or long term market disruptions.
- Stress Testing – The Bank conducts regular liquidity stress tests and scenario analysis to evaluate the potential impact of sudden and severe stress events on the Bank’s liquidity position. This enables the Bank to proactively identify appropriate funding arrangements that can be used to manage such stress situations with a minimum financial and/or reputational impact.
- Contingency Funding – The Bank has a Contingency Funding Plan which provides guidance in managing liquidity in bank specific or market specific scenarios. It outlines various ways in which the Bank monitors assets and liabilities of the Bank with an emphasis on avoiding major liquidity crisis. Procedures outlined include addressing unlikely but possible events of either short or long term funding crisis, forecast funding needs as well as funding sources under different market situations including aggressive asset growth or loan rollover and rapid liability erosion or sharp decline in deposits during a 3-month time period, which is considered the most critical time span in a liquidity crisis. Management and reporting framework includes early warning signals and means to avoid and mitigate possible crisis promptly, Management Action Plan with alternative sources of inflows and trigger levels for action, communication plan to prevent further escalation or contagion and regular sources of liquidity supplemented with contingent sources.
- Value-at-Risk Measurements (VaR) – The Bank carries out VaR calculations on four portfolios categorised as Held-for-trading (HFT), using a market risk software solution. This software has the capability of computing VaR in three methodologies namely, Historical Simulation, Monte Carlo Simulation and Variance-Covariance in order to measure its market risk exposure in an efficient manner and to meet regulatory compliance. The Bank computes VaR in line with Basel II Market Risk Framework, considering a 99% ‘Confidence Level’ and a 10-trading-days Holding Period. VaR, a quantitative measure depicts the maximum loss the Bank shall incur, under specific conditions during a given period due to changes in interest rates, exchange rates, debt and equity prices as well as price of financial products.
Liquidity Risk Review
The key ratios used for measuring liquidity under the Stock approach are depicted in Graph 22.
Liquidity RatiosGraph - 22Net Advances to Deposits Ratio is regularly monitored by ALCO to ensure that the asset and liability portfolios of the Bank are geared to maintain a healthy liquidity position.
Core Funding Ratio, an indicator of the stability of funding sources compared to loans and advances granted was maintained well above the policy threshold of 90%, which is considered healthy to support the Bank’s business model and growth.
Maturity Gap Analysis as at December 31, 2015
| Up to 1 Month Rs. Mn. | 1-3 Months Rs. Mn. | 3-6 Months Rs. Mn. | 6-12 Months Rs. Mn. | 1-3 Years Rs. Mn. | 3-5 Years Rs. Mn. | Over 5 Years Rs. Mn. | Total Rs. Mn. | |||||||||
| Cash on hand | 15,873 | – | – | – | – | – | – | 15,873 | ||||||||
| Deposits with Central Banks | 2,043 | 2,899 | 2,559 | 2,689 | 2,377 | 2,100 | 8,154 | 22,820 | ||||||||
| Balances due from head office, affiliates and own branches |
– | – | – | – | – | – | – | – | ||||||||
| Balances due from other banks | 22,497 | 4,829 | – | – | – | – | – | 27,326 | ||||||||
| Investments | 14,344 | 6,880 | 6,858 | 25,809 | 111,677 | 52,486 | 57,768 | 275,821 | ||||||||
| Bills of Exchange | 11,242 | – | – | – | – | – | – | 11,242 | ||||||||
| Overdrafts | 5,799 | 5,799 | 5,799 | 11,598 | 16,043 | 16,043 | 16,237 | 77,318 | ||||||||
| Loans and receivables | 29,079 | 54,150 | 47,477 | 47,895 | 129,907 | 68,671 | 41,700 | 418,879 | ||||||||
| NPLs | – | – | – | 189 | – | – | 567 | 756 | ||||||||
| Net inter-branch transactions | – | – | – | – | – | – | – | – | ||||||||
| Other assets | 14,478 | 27 | 25 | 46 | 713 | 87 | 10,723 | 26,100 | ||||||||
| Lines of credit committed from institutions | 1,000 | – | – | – | – | – | – | 1,000 | ||||||||
| Others (Reverse Repos) | 8,002 | – | – | – | – | – | – | 8,002 | ||||||||
| Total | 124,357 | 74,584 | 62,718 | 88,226 | 260,716 | 139,388 | 135,148 | 885,137 | ||||||||
| Demand deposits | 11,597 | 11,597 | 8,698 | 11,597 | – | – | 14,496 | 57,986 | ||||||||
| Savings deposits | 12,096 | 12,096 | 12,096 | 24,193 | 60,482 | 60,482 | 60,482 | 241,928 | ||||||||
| Balances due to Head Office, affiliates and own branches |
– | – | – | – | – | – | – | – | ||||||||
| Balances due to other banks | 6,727 | 10,431 | 2,162 | 10,090 | – | – | – | 29,411 | ||||||||
| Time deposits | 32,434 | 53,158 | 46,420 | 37,810 | 8,879 | 6,153 | 130,167 | 315,020 | ||||||||
| Certificate of deposits, borrowings and bonds | 120 | 499 | 1,028 | 1,585 | 4,240 | 140 | 14,481 | 22,093 | ||||||||
| Net inter-branch transactions | – | – | – | – | – | – | – | – | ||||||||
| Bills payable | – | – | – | – | – | – | – | – | ||||||||
| Interest payable | 2,753 | 1,572 | 1,914 | 1,911 | 1,442 | 366 | 54 | 10,012 | ||||||||
| Provisions other than NPLs and depreciation of investments | – | – | – | – | – | – | – | – | ||||||||
| Other liabilities | 13,548 | 1,504 | 1,355 | 1,271 | – | 2,145 | – | 19,823 | ||||||||
| Lines of credit committed to institutions | 1,000 | – | – | – | – | – | – | 1,000 | ||||||||
| Unutilised portion of overdrafts and advances | 109,756 | – | – | – | – | – | – | 109,756 | ||||||||
| Letters of Credit/Guarantees/Acceptance | 75,669 | 20,967 | 8,697 | 8,250 | 4,556 | 974 | 115 | 119,227 | ||||||||
| Repos/Bills Rediscounted/SWAPs/Forward Contracts | 153,564 | 93,841 | 42,928 | 62,551 | 6,920 | – | – | 359,804 | ||||||||
| Others | – | – | – | – | – | – | 74,657 | 74,657 | ||||||||
| Total | 419,265 | 205,665 | 125,298 | 159,258 | 86,519 | 70,260 | 294,452 | 1,360,717 | ||||||||
| Period Gap | (294,908) | (131,081) | (62,580) | (71,032) | 174,198 | 69,128 | (159,304) | |||||||||
| Cumulative Gap | (294,908) | (425,989) | (488,569) | (559,601) | (385,404) | (316,276) | (475,580) | |||||||||
| Cumulative Liabilities | 419,265 | 624,930 | 750,228 | 909,486 | 996,005 | 1,006,265 | 1,360,717 | |||||||||
| Cumulative Gap as a % of Cumulative Liabilities | -70% | -68% | -65% | -62% | -39% | -30% | -35% |
Table – 14
Maturity analysis of financial assets and financial liabilities of the Bank (Table 14) does not indicate any adverse situation when due cognizance is given to the fact that cash outflows include savings deposits which can be considered as a quasi stable source of funds based on historical behavioural patterns of such depositors.
The liquidity position is measured in all major currencies at both individual and aggregate levels to ensure that potential risks are within specified threshold limits. Additionally, potential liquidity commitments resulting from loan disbursements and undrawn overdrafts are also monitored to ensure sufficient funding sources.
Funding Diversification by Product
The Bank’s primary sources of funding are deposits from customers. A product-wise analysis of the Bank’s funding diversification as at year-end is given below (Graph 23):
Funding Diversification by ProductGraph - 23Credit Ratings
The Bank’s ability to borrow is significantly dependent on its credit ratings which were as follows:
| Operations/Entity | Rating Agency | Rating | ||
| Commercial Bank of Ceylon PLC | Fitch Ratings Lanka Ltd. | AA (lk) | ||
| Bangladesh | Credit Rating Information and Services Ltd. (CRISL) | AAA |
Table – 15
The rating of AA (lk) is the strongest rating given to a Sri Lankan non-state sector bank and was re-affirmed by Fitch Ratings Lanka Ltd. in 2015. The AAA (Triple A) long-term credit rating accorded to the Bangladesh operations of Commercial Bank of Ceylon PLC has been reaffirmed by CRISL for the fifth consecutive year in 2015 (Table 15).
Operational Risk
The Bank is exposed to Operational Risk as it is inherent in all banking products and processes. Operational Risk is defined as the risk of losses stemming from inadequate or failed internal processes, people and systems, or from external events such as natural disasters, social or political events. Operational Risk includes Legal Risk but excludes Strategic and Reputational Risk.
Managing Operational Risk
The Bank manages Operational Risk based on an organisation-wide consistent framework that enables determination of its Operational Risk profile in comparison to its risk appetite and systematically identifies Operational Risk themes and concentrations to define risk mitigating measures and priorities. These are described below:
- Governance – The Board of Directors is responsible for ensuring that a sufficiently robust framework for managing Operational Risks is established, and are aided in this duty by the BIRMC. The Bank’s ‘First Line of Defence’ are the management and staff of the Bank and a rigorous system of review is in place to identify Operational Risks within the strategic business units. The Chief Risk Officer who reports directly to the BIRMC spearheads the Independent Operational Risk Management Unit (ORMU) which supports the EIRMC in monitoring Operational Risk providing independent oversight of the First Line of Defence. Internal Audit provides assurance on the effectiveness and integrity of the first and second lines of defence independently to the BAC.
- Policies – The Bank’s Operational Risk Management Framework defines the Bank’s approach in identifying, assessing, mitigating, monitoring and reporting the Operational Risks which may impact the achievement of the Bank’s business objectives. The Risk Management responsibilities and obligations of the Board of Directors, Corporate Management, ORMU and all other Risk Owners are clearly specified in the Operational Risk Management Policy which is reviewed annually by the Board.
- Risk Assessment – Each business function within the Bank proactively identifies and assesses its significant Operational Risks and the controls in place to manage those risks in a semi-annual Risk and Control Self-Assessment (RCSA) process which is automated via the Operational Risk Management System. Findings from the RCSA exercise is used to formulate appropriate action plans to address identified control gaps which are monitored as part of the overall Operational Risk Management exercise. The Bank also conducts reviews of new products, processes, services, operations, etc. in order to assess risk on a regular basis.
- Risk Mitigation – Risk mitigation is planned in accordance with the ‘As Low As Reasonably Practicable (ALARP)’ principle by balancing the cost of mitigation with the benefits thereof and formally accepting the Residual Risk. Several risk mitigation policies and programmes, including the robust internal control framework are in place to maintain a sound operating environment within the established risk appetite of the Bank.
- Insurance coverage is used as an external mitigant for ‘low probability – high impact’ events and uncontrollable Operational Risk events such as damage to physical assets by natural disasters, fire etc. Insurable risks are transferred to reputed insurance providers, which are periodically reviewed comprehensively by the ORMU for adequacy.
- Policies and procedures relating to outsourcing of business activities of the Bank ensures that all significant risks arising from outsourcing arrangements of the Bank are identified and effectively managed on a continuous basis. Details of all outsourced functions are reported to CBSL annually. Due diligence tests of outsourced vendors are carried out by respective Risk Owners prior to entering into new agreements and renewal of existing agreements. Assistance of Information Systems (IS) Audit Unit is obtained when conducting due diligence tests of outsourced parties who provide IT services.
- Technology Risk is managed in a systematic and consistent manner to avoid potential operational losses to the Bank resulting from technological obsolescence. Accordingly, existing Information Technology systems including the Core-Banking system are upgraded and new software solutions are implemented in a timely and appropriate manner.
- The Bank has a comprehensive Business Continuity Plan (BCP) and Disaster Recovery Plan (DRP) to assure the immediate continuity of all essential operations in case of a disaster and the eventual continuity of all other operations, which are continuously updated and tested to ensure ongoing readiness. These plans are reviewed independently by ORMU and Bank’s Internal Audit in line with CBSL requirements.
- Creating a culture of risk awareness across the Bank through comprehensive training programmes together with high standards of ethics and integrity is also a key component of the Bank’s risk mitigatory measures.
- Monitoring and Reporting of Operational Risk – Key Operational Risk Indicators (KORIs) are monitored against the corresponding tolerance levels which are reported to designated committees and Board. KORIs are statistical data collected and monitored by the ORMU on an ongoing basis to enable early detection of potential risks and possible operational control weaknesses relating to both financial and non-financial events. These include monitoring and reporting of compliance with mandatory banking and other statutory requirements, abnormal transactions including Anti-Money Laundering and Terrorist Financing Activities, and internal and external reporting of Operational Risk events. A database of Operational Risk events and losses, including losses without any financial impact and ‘near misses’ has been established through the Operational Risk Management System to facilitate the analysis of loss trends and root causes as prescribed in Basel II. This is a key component in progressing towards advanced approaches in Operational Risk capital calculations in future.
- Tolerance Levels – The Bank has a low appetite for Operational Risks and has established tolerance levels for all material Operational Risk loss types by considering several factors which include historical loss data, budgets and forecasts, performance of the Bank, existing systems and controls governing Bank operations, etc. Thresholds established for monitoring purposes, considering audited financials are:
- Alert Level – 3% of the average gross income for the last three years.
- Maximum Level – 5% of the average gross income for the last three years.
In addition to the above, thresholds for selected non-financial Operational Risk Indicators such as staff turnover, system failures, etc., are also in force, which are reported to the EIRMC and BIRMC on a regular basis in order to initiate corrective action where necessary.
- Stress Testing of Operational Risk – The Bank commenced conducting of Stress Testing on operational losses during the year 2014 by considering the historical data as per the scenarios proposed in the Stress Testing Policy of the Bank. This exercise is being carried out quarterly by the Bank as an additional measure to confirm its sound position.
Operational Risk Review
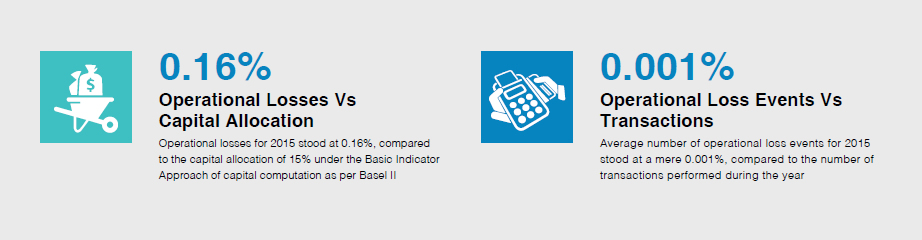
Operational losses for the financial year 2015 were well below the internal Alert level at 0.16% (of average audited gross income for last three years) which is a further improvement compared to 2014 (i.e. 0.28%) reflecting the ‘tone at the top’ and the effectiveness of the governance structures, processes and procedures in place to manage Operational Risk. The trend line in the Graph 24 also demonstrates the Bank’s consistency in maintaining losses at minimal levels over the period of the last seven years.
Actual Operational Losses Against Internal Alert Levels for Year 2009-15Graph - 24The Graph 25 analyses Operational Risk losses incurred by the Bank under each business line/loss event type during the year 2015.
Classification of Losses Under Basel II Business Lines – 2015Graph - 25When analysing the losses incurred during 2015 under the Basel II defined business lines, it is evident that the composition remains consistent with the previous years where the majority of losses (93%) with financial impact falls under the ‘Retail Banking’ business line, followed by the losses reported under the business line of ‘Payment and Settlements’. Losses relating to other business lines remain negligible.
The Graphs 26 to 29 depict the comparison of operational losses reported during the last two years (2015 and 2014) under each Basel II loss event type both in terms of number of occurrences and value:
Composition of Losses by Type – Based on Number of Events – 2015Graph - 26 Composition of Losses by Type – Based on Number of Events – 2014Graph - 27As typical with operational risk losses, the majority of the losses encountered by the Bank during 2015 comprised high frequency/ low financial impact events mainly falling under the loss type ‘Execution, Delivery and Process Management’. These low value events are mainly related to cash and ATM operations of the Bank’s service delivery network consisting of over 900 points across Sri Lanka and Bangladesh. Individual events with monetary values less than Rs. 100,000/- account for more than 97% of the total loss events for the year. Also, the average number of loss events for the year stands at a mere 0.001% when compared to the number of transactions performed during the year.
Composition of Losses by Type – Based on Value – 2015Graph - 28 Composition of Losses by Type – Based on Value – 2014Graph - 29When considering the values of the losses incurred by the Bank during 2015, they can be mainly categorized under Execution, Delivery & Process Management related, External Frauds, Damages to Physical Assets and Business Disruptions & System Failures. Nevertheless, as described earlier, total of the actual Operational Risk related losses for 2015 remains at a mere 0.16% of the average audited gross income for the last three years, as compared to the capital allocation of 15% under the Basic Indicator Approach of capital computation as per Basel II. This trend of exceptionally low levels of operational risk losses of the Bank bears testimony to the effectiveness of the Bank’s Operational Risk Management Framework and the internal control environment.
IT Risk
IT Risk is a growing area of concern globally as threats have increased in magnitude and audacity dominating business news headlines. It is defined as the business risk associated with the use, ownership, operation, involvement, influence and adoption of IT within an organisation and is a major component of Operational Risk. IT Risk comprises IT-related events such as system interruptions, errors, frauds through system manipulations, obsolescence in applications, falling behind competitors concerning the technology, etc. that could potentially impact the business as a whole. It can occur with both uncertain frequency and magnitude, creating challenges in meeting strategic goals and objectives of the Bank.
A dedicated, independent IT Risk Function under the ORMU is responsible for implementation of the IT Risk Management Framework facilitating management of all significant IT Risks in a consistent and effective manner across the Bank. This has enabled developing the highly specialised skills set required for this rapidly evolving role.
The IT Risk Management Policy, aligned with the Operational Risk Management Policy of the Bank complements the Information Security Policy, the related processes, objectives and procedures relevant for managing risk and improving information security of the Bank.
Risk Control Self Assessment (RCSA) is used as the core mechanism for IT Risk identification and assessment, while the IT Risk Unit carries out independent IT Risk reviews both separately and in conjunction with regular Operational Risk reviews in line with the established structure of the Operational Risk Management process. Results of these independent IT Risk assessments together with audit findings, analysis of information security incidents, internal and external loss data are also employed for IT Risk identification and assessment purposes.
IT Risk mitigation involves prioritising, evaluating and implementing the appropriate risk-reducing controls or risk treatment techniques recommended from the risk identification and assessment process. The Bank has implemented a range of controls including technical, operational and management controls required to mitigate its identified IT Risks and potential vulnerabilities, strengthened by the Bank’s implementation of an Information Security Management System (ISMS) established as per ISO 27001:2013 Information Security Standard.
The IT Risk Unit carries out continuous monitoring of Key IT Risk Indicators (KIRIs) with corresponding thresholds defined as ‘Tolerable’, ‘Alert’ and ‘Unacceptable’. KIRIs outside set thresholds receive a differential level of management attention in order to initiate appropriate corrective actions.
Legal Risk
Legal Risk is defined as the exposure to the adverse consequences resulting from inaccurately drafted contracts, their execution, the absence of written agreements or inadequate agreements. An integral part of Operational Risk, Legal Risk includes, but is not limited to, exposure to fines, penalties, or punitive damages resulting from supervisory actions, as well as private settlements.
Legal Risk is managed by ensuring that applicable regulations are fully taken into consideration in all relationships and contracts with individuals and institutions who maintain business relationships with the Bank, and that they are supported by required documentation whereas risk of breaching the rules and regulations are managed by establishing and operating a sufficient mechanism for verification of conformity of operations with applicable regulations.
Compliance and Regulatory Risk
Compliance and Regulatory Risk refers to the potential risk of incurring regulatory sanctions, financial and/or reputational damage arising from failure to comply with applicable laws, rules and regulations and Codes of Conduct applicable to banking activities.
A Compliance Function reporting directly to Board of Directors is in place to assess the Bank’s compliance with external and internal regulations. A comprehensive Compliance Policy describing how this key risk is identified, monitored and managed by the Bank in a structured manner is in place.
With regard to its card operations, the Bank has identified possible chargebacks for the Bank with the shifting of fraud liability to Acquirers effective from October 2015 due to non-compliance to EMV Standards. Accordingly, Bank has already converted over 450 ATMs to be EMV compliant.
Other Related Risks
Strategic Risk
Strategic Risks are those that either affect or are created by strategic decisions. They could materialise due to internal or external factors that can cause reduction in shareholder value, loss of earnings, etc. Strategic goals determined through the Corporate Planning and Budgeting process and critical evaluation of their alignment with the Bank’s Vision, Mission and the risk appetite facilitates management of Strategic Risk. The detailed Scorecard-based qualitative model aligned to ICAAP is used to measure and monitor Strategic Risk of the Bank. This Scorecard-based approach takes into consideration a range of factors, including the size and sophistication of the organisation, the nature and complexity of its activities in measuring Strategic Risk and highlights the areas that need emphasis to mitigate potential Strategic Risks.
Reputational Risk
Reputational Risk is the risk of adverse impact on earnings or organisational value arising from negative stakeholder perception of the Bank’s business practices, activities and financial condition. The Bank recognises that Reputational Risk is driven by a wide range of other business risks that must all be actively managed. Accordingly, Reputational Risk is broadly managed through the systems and controls adopted for all other risk types such as Credit, Market, Operational Risk, etc., which are underpinned by the Code of Conduct and business ethics which is applicable to all employees and Directors. Further, Reputational Risk is measured through a detailed Scorecard-based model developed by the Bank to measure and monitor Reputational Risk under ICAAP. Timely actions are initiated to mitigate potential Reputational Risks by critically evaluating the criteria given in the said Scorecard.
Capital Management
The Bank manages its capital with the objective of maintaining sufficient capital for its regulatory requirements, business needs, and requirements identified through stress testing. The Internal Capital Adequacy Assessment Process (ICAAP) Framework in line with Basel II requirements implemented in the Bank in 2012 introduced a process for assessing total overall capital adequacy in relation to its risk profile.
ICAAP supports the regulatory review process providing valuable inputs for evaluating the required capital in line with future business plans. It integrates strategic plans and risk management plans with the capital plan in a meaningful manner with inputs from Senior Management, Management Committees, Board Sub-Committees and the Board. It also supports proactive decision-making on exposures both current and potential through measurement of vulnerabilities by carrying out stress testing and scenario-based analysis. The ICAAP process also identifies gaps in managing qualitative and quantitative aspects of Reputational Risk and Strategic Risk which are not covered under Pillar 1 of Basel II.
Stress Testing
Stress testing is an integral part of ICAAP under Pillar 2 used to evaluate the sensitivity of the current and future risk profile relative to risk appetite. Stress testing supports a number of business processes, including strategic planning, the ICAAP including capital management, liquidity management, setting of risk appetite triggers and risk tolerance limits, mitigating risks through actions such as reviewing and changing limits, limiting or reducing exposures and hedging thereof, facilitating the development of risk mitigation or contingency plans across a range of stressed conditions supporting communication with internal and external stakeholders.
The Bank’s Stress Testing Governance Framework sets out the responsibilities for and approaches to stress testing activities which are conducted at Bank, business line and risk type level. The group’s stress testing programme uses one or a combination of stress testing techniques, including scenario analysis, sensitivity analysis and reverse stress testing to perform stress testing for different purposes. As it provides a broader view of all risks borne by the Bank in relation to its risk tolerance and strategy in a hypothetical stress situation, stress testing has become an effective communication tool to Senior Management, Risk Owners, Risk Managers as well as Supervisors and Regulators. The results of the stress testing are reported to the EIRMC and BIRMC on a quarterly basis for appropriate, proactive decision-making.
Regulatory Capital
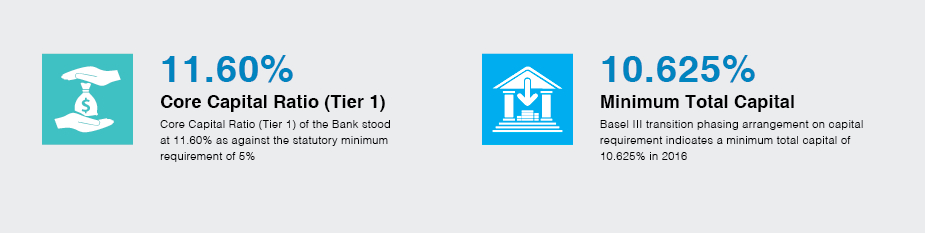
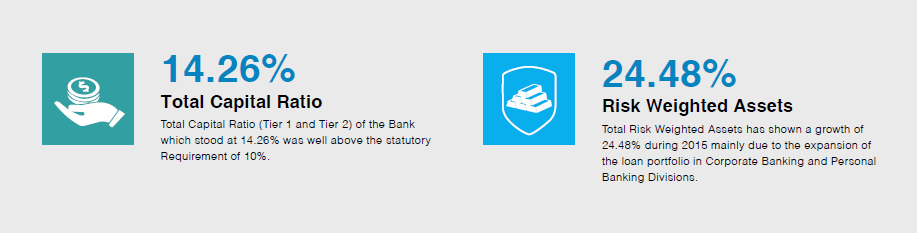
Regulatory guidelines require the Bank to maintain a Capital Adequacy Ratio (CAR) of not less than 5% Core Capital (Tier I) and a minimum overall CAR of 10% of Core Capital and Supplementary Capital (Tier II) in relation to total risk-weighted assets.
Capital Adequacy CompositionGraph - 30Tier I and Tier II capital adequacy ratios of the Bank as at end of 2015 stood at 11.60% and 14.26% respectively compared to 12.93% and 15.97% as at end of 2014. (Group Tier I & Tier II Capital for 2015 stood at 11.55% and 14.28%) as detailed in Table 16. A decreasing trend in CAR is observed mainly due to portfolio growth in loans and receivables to customers during 2015. The Bank has consistently maintained higher levels of capital than the minimum regulatory requirement as observed from the Graph 30.
With the objective of achieving a more resilient banking system in the country, CBSL is to implement Basel III minimum capital requirements and leverage ratio framework in Sri Lanka
In line with such directive, introduction of various capital buffers and strengthening of level of capital as well as avoidance of systemic risk is expected to be achieved. The Bank is gearing to embrace changes to be proposed in line with this and work towards providing a safe banking system to our stakeholders.
Capital Adequacy Computation – Group
Pillar I Capital Calculation
1. Capital Adequacy Ratios
1.1 Core Capital Ratio
| As at December 31, | 2015 | 2014 |
| Total Eligible Core Capital (Tier I Capital) (Refer Note 2.1) (Rs. ’000) | 64,914,870 | 58,662,124 |
| Total Risk-Weighted Assets (Refer Note 3) (Rs. ’000) | 561,797,327 | 448,906,024 |
| Total Eligible Core Capital (Tier I Capital) (Minimum Requirement 5%) (%) | 11.55 | 13.07 |
1.2 Total Capital Ratio
| As at December 31, | 2015 | 2014 |
| Total Capital Base (Refer Note 2.2) (Rs. ’000) | 80,218,414 | 72,832,325 |
| Total Risk Weighted Assets (Refer Note 3) (Rs. ’000) | 561,797,327 | 448,906,024 |
| Total Capital Ratio (Minimum Requirement 10%) (%) | 14.28 | 16.22 |
2. Computation of Capital
2.1 Computation of Eligible Core Capital (Eligible Tier I Capital)
| As at December 31, | 2015 (Rs. ’000) |
2014 (Rs. ’000) |
| Paid-up Ordinary Shares/Common Stock/Assigned Capital | 23,254,605 | 21,457,501 |
| Statutory Reserve Fund | 4,922,367 | 4,327,103 |
| Published Retained Profits/(Accumulated Losses) | 1,557,331 | 1,667,087 |
| General and Other Reserves | 36,015,294 | 32,020,287 |
| Minority Interests (consistent with the above capital constituents) | 50,208 | 47,564 |
| Less: Deductions/adjustments | ||
| Goodwill | 400,045 | 400,045 |
| Other intangible assets | 483,989 | 456,185 |
| Advances granted to employees of the Bank for the purchase of shares of the Bank (ESOP) | 499 | 786 |
| 50% investments in the capital of other banks and financial institutions | 402 | 402 |
| Total Eligible Core Capital (Tier I capital ) | 64,914,870 | 58,662,124 |
2.2 Computation of Total Capital Base (Regulatory Capital)
| As at December 31, | 2015 (Rs. ’000) |
2014 (Rs. ’000) |
| Total Eligible Core Capital (Tier I Capital) (Refer Note 2.1 Above) | 64,914,870 | 58,662,124 |
| Supplementary Capital | ||
| Revaluation Reserves (as approved by the Central Bank of Sri Lanka) | 2,034,231 | 2,034,231 |
| General Provisions | 2,351,948 | 1,836,058 |
| Approved Subordinated Term Debt | 10,917,767 | 10,300,314 |
| Less: Deductions/Adjustments | ||
| 50% Investments in the Capital of Other Banks and Financial Institutions | 402 | 402 |
| Total Capital Base | 80,218,414 | 72,832,325 |
3. Computation of Risk-Weighted Assets – RWA
| As at December 31, | 2015 | 2014 |
| Credit Risk | ||
| RWA of On-balance sheet assets (Refer Note 4.1) | 458,837,165 | 357,895,337 |
| RWA of Off-balance sheet assets (Refer Note 4.2) | 39,319,568 | 36,624,440 |
| Total RWA for Credit Risk (a) | 498,156,733 | 394,519,777 |
| Market Risk | ||
| Capital Charge for Interest Rate Risk | 561,648 | 525,669 |
| Capital Charge for Equities | 61,176 | 70,347 |
| Capital Charge for Foreign Exchange and Gold | 143,204 | 123,188 |
| Total Capital Charge for Market Risk | 766,028 | 719,204 |
| Total RWA for Market Risk (Total Capital Charge for Market Risk x 10) (b) | 7,660,279 | 7,192,045 |
| Operational Risk | ||
| Gross Income | ||
| Year 1 | 35,666,060 | 32,989,114 |
| Year 2 | 35,273,703 | 24,964,114 |
| Year 3 | 41,020,866 | 36,435,177 |
| Average Gross Income | 37,320,210 | 31,462,802 |
| Total Capital Charge for Operational Risk – (Average Gross Income x 15%) | 5,598,031 | 4,719,420 |
| Total RWA for Operational Risk – (Total Capital Charge for Operational Risk x 10) (c) | 55,980,315 | 47,194,203 |
| Total Risk-Weighted Assets (a + b + c) | 561,797,327 | 448,906,024 |
4. Computation of RWA of On-Balance Sheet and Off-Balance Sheet Assets
4.1 Computation of RWA of On-Balance Sheet Assets
| As at December 31, | 2015 | 2014 | |||
| Risk Weight Factor % | On Balance Sheet Assets Rs.'000 | Risk Weighted Assets Rs.'000 | On Balance Sheet Assets Rs.'000 | Risk Weighted Assets Rs.'000 | |
| Claims on Government of Sri Lanka and Central Bank of Sri Lanka | 0 | 278,819,777 | – | 296,402,175 | – |
| Claims on Foreign sovereigns and their Central Banks | 0-150 | 10,963,272 | 10,963,272 | 14,474,568 | 14,474,568 |
| Claims on Public Sector Entities (pses) | 20-150 | 2,176,061 | 2,176,061 | 2,001,386 | 2,001,386 |
| Claims on Banks | 0-150 | 21,931,045 | 10,693,390 | 22,000,718 | 9,123,717 |
| Claims on Financial Institutions | 20-150 | 32,635,103 | 13,736,419 | 6,717,256 | 2,595,421 |
| Claims on Corporates | 20-150 | 229,452,108 | 222,334,225 | 180,382,044 | 163,169,705 |
| Retail Claims | 75-100 | 151,746,375 | 126,561,595 | 128,387,920 | 106,252,471 |
| Claims Secured by Residential Property | 50-100 | 43,268,979 | 35,778,552 | 34,128,075 | 27,615,834 |
| Non-Performing Assets (npas) | 50-150 | 7,232,518 | 9,702,823 | 7,673,647 | 10,687,124 |
| Cash Items | 0-20 | 15,951,475 | 3,907 | 13,678,575 | 950 |
| Property, Plant & Equipment | 100 | 11,288,672 | 11,288,672 | 11,243,805 | 11,243,805 |
| Other Assets | 100 | 15,598,248 | 15,598,248 | 10,730,355 | 10,730,356 |
| Total | 821,063,633 | 458,837,164 | 727,820,524 | 357,895,337 | |
4.2 Computation of RWA of Off-Balance Sheet Assets
| As at December 31, | 2015 | 2014 | |||
| Credit Conversion Factor % | Principal Amount of Off-Balance Sheet Assets Rs. ’000 | Risk Weighted Assets Rs. ’000 | Principal Amount of Off-Balance Sheet Assets Rs. ’000 | Risk Weighted Assets Rs. ’000 | |
| Claims on Banks | |||||
| (a) Foreign Exchange Contracts | 2 | 213,383,575 | 1,335,748 | 110,163,778 | 1,478,510 |
| (i) Original Maturity-less than one year | 213,383,575 | 1,335,748 | 110,163,778 | 1,478,510 | |
| Claims on Corporates | |||||
| (a) Direct Credit Substitutes | 100 | 19,525,544 | 16,782,075 | 19,339,591 | 18,094,265 |
| (i) General Guarantees of Indebtedness | 19,525,544 | 16,782,075 | 19,339,591 | 18,094,265 | |
| (b) Transaction-related Contingencies | 50 | 11,610,441 | 5,600,459 | 9,655,456 | 4,825,310 |
| (ii) Performance Bonds, Bid Bonds & Warranties | 11,610,441 | 5,600,459 | 9,650,119 | 4,822,641 | |
| (ii) Others | – | – | 5,337 | 2,669 | |
| (c) Short Term Self-Liquidating Trade-Related Contingencies | 20 | 54,293,156 | 10,620,306 | 44,215,017 | 8,725,516 |
| (i) Shipping Guarantees | 1,755,562 | 336,409 | 2,042,463 | 386,509 | |
| (ii) Documentary Letters of Credit | 26,441,578 | 5,064,694 | 19,629,284 | 3,830,353 | |
| (iii) Trade Related Acceptances | 387,284 | 77,457 | 1,663,030 | 332,606 | |
| (iv) Others | 25,708,732 | 5,141,746 | 20,880,240 | 4,176,048 | |
| (d) Foreign Exchange Contracts | 32,729,935 | 476,461 | 19,457,853 | 374,013 | |
| (i) Original Maturity-Less than one year | 2 | 26,286,091 | 411,071 | 19,259,628 | 364,102 |
| (ii) Original Maturity-More than one year and less than two years | 5 | 6,443,844 | 65,390 | 198,225 | 9,911 |
| Retail Claims | |||||
| (a) Direct Credit Substitutes | 100 | 6,163,524 | 3,412,998 | 5,220,140 | 1,840,022 |
| (i) General Guarantees of Indebtedness | 6,163,524 | 3,412,998 | 5,220,140 | 1,840,022 | |
| (b) Transaction-related Contingencies | 50 | 2,484,828 | 578,091 | 2,387,898 | 454,785 |
| (ii) Performance Bonds, Bid Bonds & Warranties | 2,484,828 | 578,091 | 2,387,898 | 454,785 | |
| (c) Short Term Self-Liquidating Trade-Related Contingencies | 20 | 3,898,084 | 513,430 | 5,785,464 | 832,019 |
| (i) Shipping Guarantees | 178,038 | 28,044 | 128,185 | 17,394 | |
| (ii) Documentary Letters of Credit | 3,720,046 | 485,386 | 5,657,279 | 814,625 | |
| Other Commitments with an Original maturity of up to one year or which can be unconditionally cancelled at any time | 0 | 127,288,911 | – | 97,266,455 | – |
| Undrawn Term Loans | 38,435,052 | – | 15,766,856 | – | |
| Undrawn Overdraft Facilities/Unused Credit Card Lines | 71,320,764 | – | 56,599,992 | – | |
| Others | 17,533,095 | – | 24,899,607 | – | |
| Total | 471,377,998 | 39,319,568 | 313,491,652 | 36,624,440 | |
Table – 16